Visualizing Your Content's Evolution: A Content Creator's Guide to Revision Graph in Drupal

What is Revision Graph?
As content creators, we often find ourselves making numerous changes to our content over time. Whether you’re updating information, refining language, or collaborating with team members, keeping track of these changes can become challenging. This is where Drupal’s Revision Graph module comes to the rescue.
Revision Graph transforms Drupal’s standard revision history into an intuitive, visual timeline that makes it easy to understand how your content has evolved. Think of it as a family tree for your content, showing you every version, who created it, when it happened, and how different versions relate to each other.
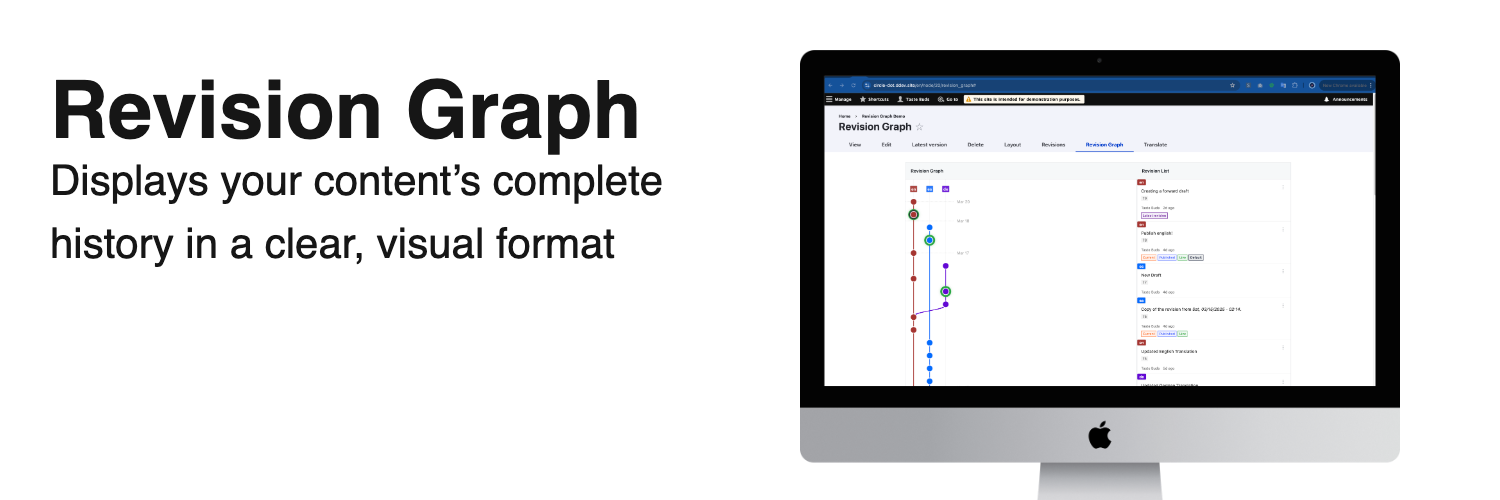 Caption: Revision Graph displays your content’s complete history in a clear, visual format
Why Content Creators Love Revision Graph
1. See Your Content’s Complete Journey
Traditional revision lists show you changes in a simple chronological order. Revision Graph goes further by displaying the relationships between revisions, making it easier to understand the full context of your content’s development.
With color-coded branches and clear connections between revisions, you can:
- Track how content has evolved across translations
- See where content branches diverged and merged
- Identify who made specific changes and when
2. Easily Navigate Complex Revision Histories
For content with extensive editing histories or multiple contributors, Revision Graph provides:
- Interactive Nodes: Click on any revision to see detailed information
- Detailed Popups: See exactly who changed what and when
- Accessible Navigation: Use keyboard shortcuts to move between revisions
 Caption: Detailed revision information is just a click away
3. Contextual Understanding with Date Markers
One of Revision Graph’s most helpful features is its horizontal date markers that show you when changes were made. This temporal context helps you:
- Identify periods of heavy editing activity
- Correlate content changes with external events or campaigns
- Understand how your content has evolved over specific time periods
4. Accessibility Built In
Revision Graph was designed with accessibility in mind:
- Fully keyboard navigable
- Screen reader friendly
- Clear visual indicators
- Support for reduced motion preferences
How to Start Using Revision Graph Today
Installation (For Your Development Team)
The beauty of Revision Graph is how easy it is to add to your Drupal site. There are no complex configurations, dependencies, or side effects to worry about. Your development team simply needs to:
- Run one command:
composer require drupal/revision_graph - Enable the module:
drush en revision_graph
That’s it! No additional configuration is required. The module works immediately with any content type that has revisions enabled.
Using Revision Graph as a Content Creator
Once installed, using Revision Graph is straightforward:
Viewing the Revision Graph
- Navigate to any piece of content you’ve created or edited
- Look for the “Revision Graph” tab next to the standard “Revisions” tab
- Click on it to see your content’s visual revision history
Understanding What You See
- Circles: Each circle represents a revision of your content
- Lines: Show the relationship between revisions
- Date Markers: Horizontal lines indicating when changes were made
- Branch Labels: Text at the top showing branch names (usually language codes for translated content)
- Default Revision: The default revision is highlighted with dark circle.
- Live Revisions: Live revisions for each language is marked by a green circle.
 Caption: Understanding the key elements of the Revision Graph
Working with the Graph
- View Details: Click on any revision circle to see who made the change, when, and their commit message
- Take Action: Each revision has quick links to:
- View that specific version
- Revert your content to that version
- Compare with the current version
Real-World Scenarios: When Revision Graph Shines
Scenario 1: Content Collaboration
When multiple team members work on the same content, Revision Graph helps you visualize who contributed what and when. This is invaluable for:
- Editorial teams managing approvals
- Content creators collaborating on complex pieces
- Managers tracking team contributions
Scenario 2: Multilingual Content Management
If your site has content in multiple languages, Revision Graph shows you how translations have evolved relative to each other, making it easier to ensure consistency across languages.
Scenario 3: Content Audits and Governance
When performing content audits, Revision Graph provides a clear picture of how content has changed over time, helping you:
- Identify outdated sections
- Understand the evolution of messaging
- Track compliance updates
Getting Started Today
Ask your site administrator or development team about adding Revision Graph to your Drupal site. Since it requires no configuration and has no side effects, it’s one of the easiest, yet most powerful—tool, you can add to your content creation toolkit.
References
- Revision Graph Project Page on Drupal.Org
- Source code for Revision Graph.
- Documentation on Drupal.org regarding Node Revisions